
HAR Research
The High Altitude Radar (HAR) group focuses on three main areas of atmospheric research: hurricanes, precipitation and clouds. The data collected in field campaigns from these areas are used in algorithms to retrieve important geophysical variables such as winds, latent heat, precipitation and cloud variables. These data and retrievals allow for a detailed understanding of the dynamics of these phenomena with implications for the numerical modeling of weather and climate.
Hurricane Research
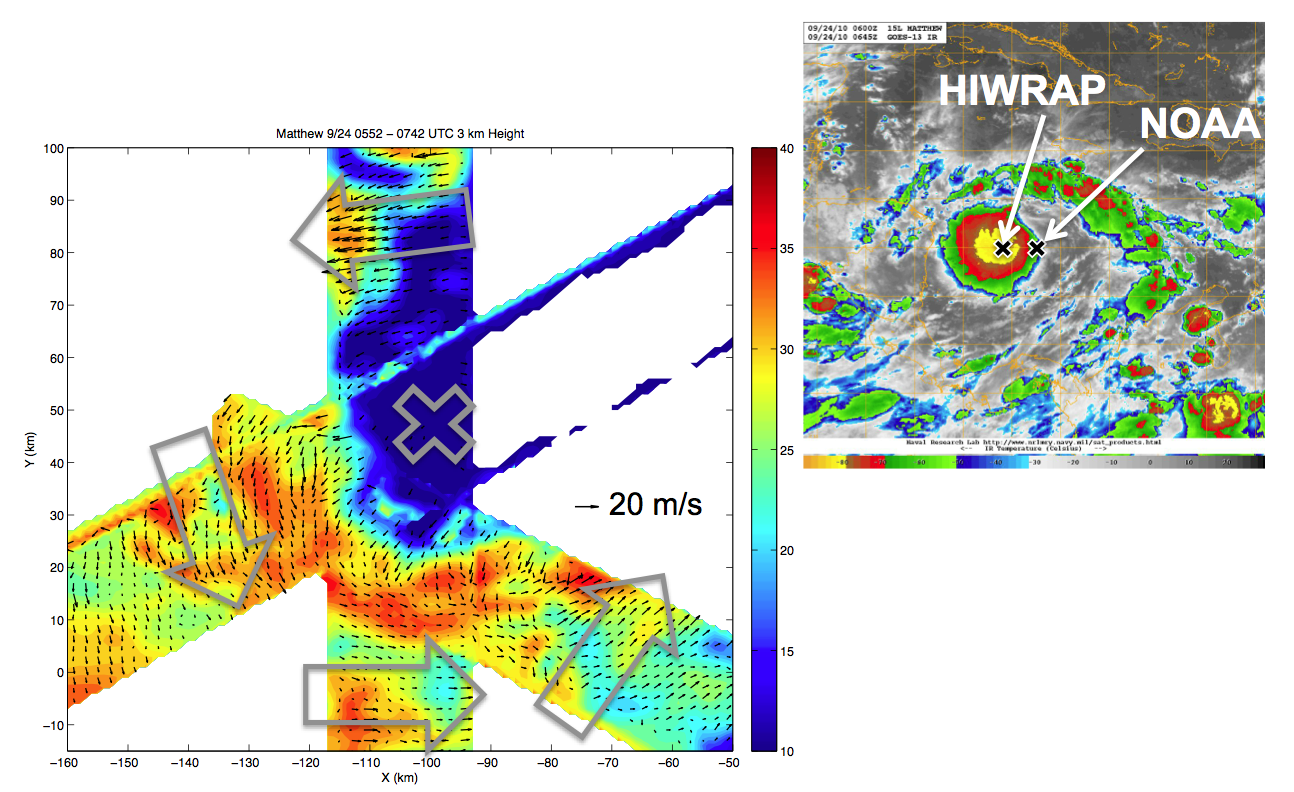
In the figure below, preliminary retrievals of the horizontal wind vector at 3 km height in Tropical Storm Matthew (2010) on September 24th reveal a partial eyewall built by deep convective towers in the down-shear portion of the storm. The colors show Ku-band reflectivity (dBZ) and the arrows reveal the flow structure in the storm. The analysis has a grid spacing of 1 km and is referenced to the National Hurricane Center's estimate of the center of Matthew at 0600 UTC, which is well to the east of the circulation defined by HIWRAP (shown by the "X").
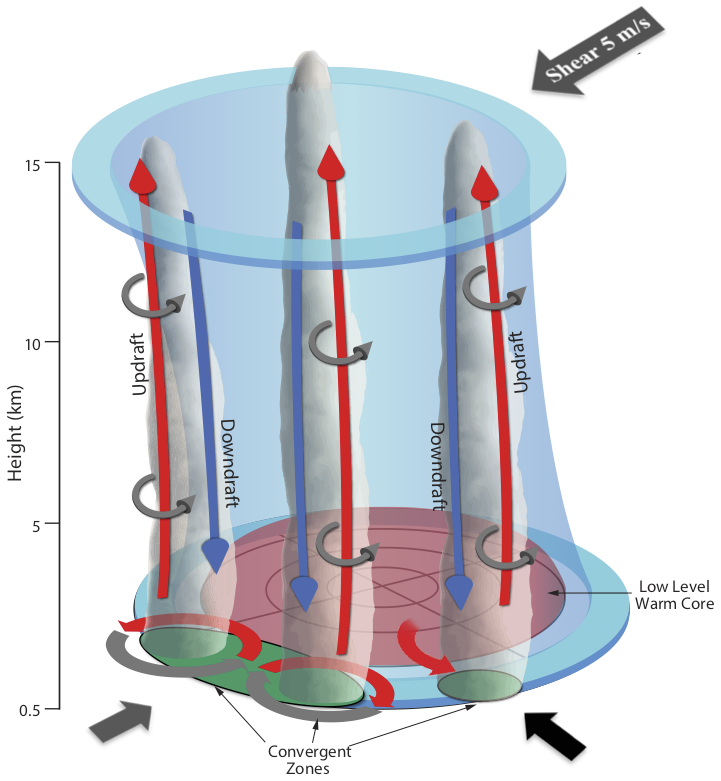
The conceptual diagram highlighted below illustrates the inner-core dynamics responsible for generating convective bursts in the rapid intensification of Hurricane Karl (2010). This diagram is a synthesis of measurements from a variety of NASA and NOAA instruments during the NASA GRIP field experiment with the HIWRAP radar on the Global Hawk playing a key role in the science discoveries. Specifically, mesovortices located at the eye-eyewall interface were found to create preferred convergence zones and mix high energy air from the eye to the eyewall, initiating and invigorating convective bursts that power the storm.
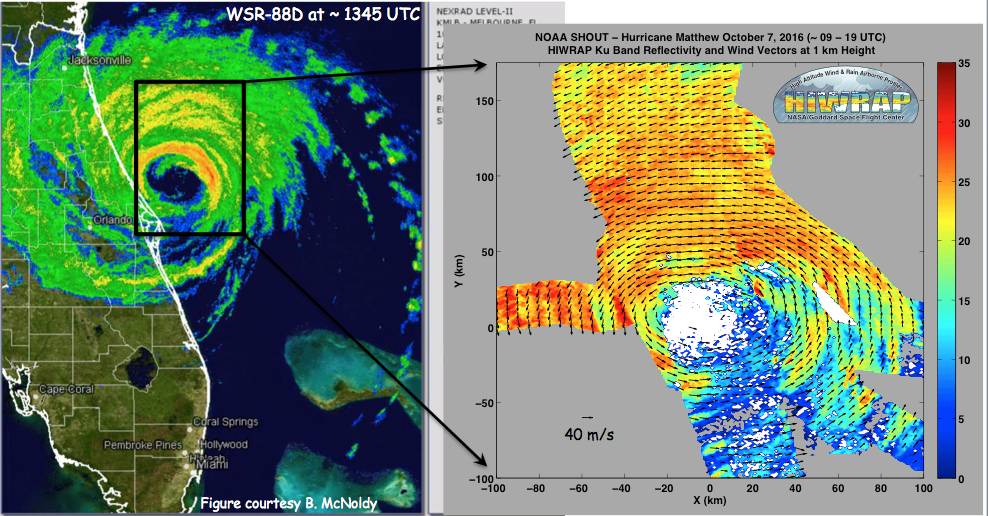
In the figure below, preliminary retrievals of the horizontal wind vector at 1 km height in Hurricane Matthew (2016) on October 7th are shown from HIWRAP onboard the Global Hawk aircraft during the NOAA SHOUT field experiment. The HIWRAP figure is on the right with colors showing Ku-band reflectivity (dBZ) and the arrows reveal the flow structure in the storm. The analysis is a composite of data covering ~ 0900 - 1900 UTC on a storm-following grid with a spacing of 1 km. The figure on the left shows S-band reflectivity from a NOAA WSR-88D at the center of the HIWRAP sampling interval.
Links to additional HAR work on hurricanes:
Precipitation Research
Understanding GPM precipitation retrievals with HIWRAP